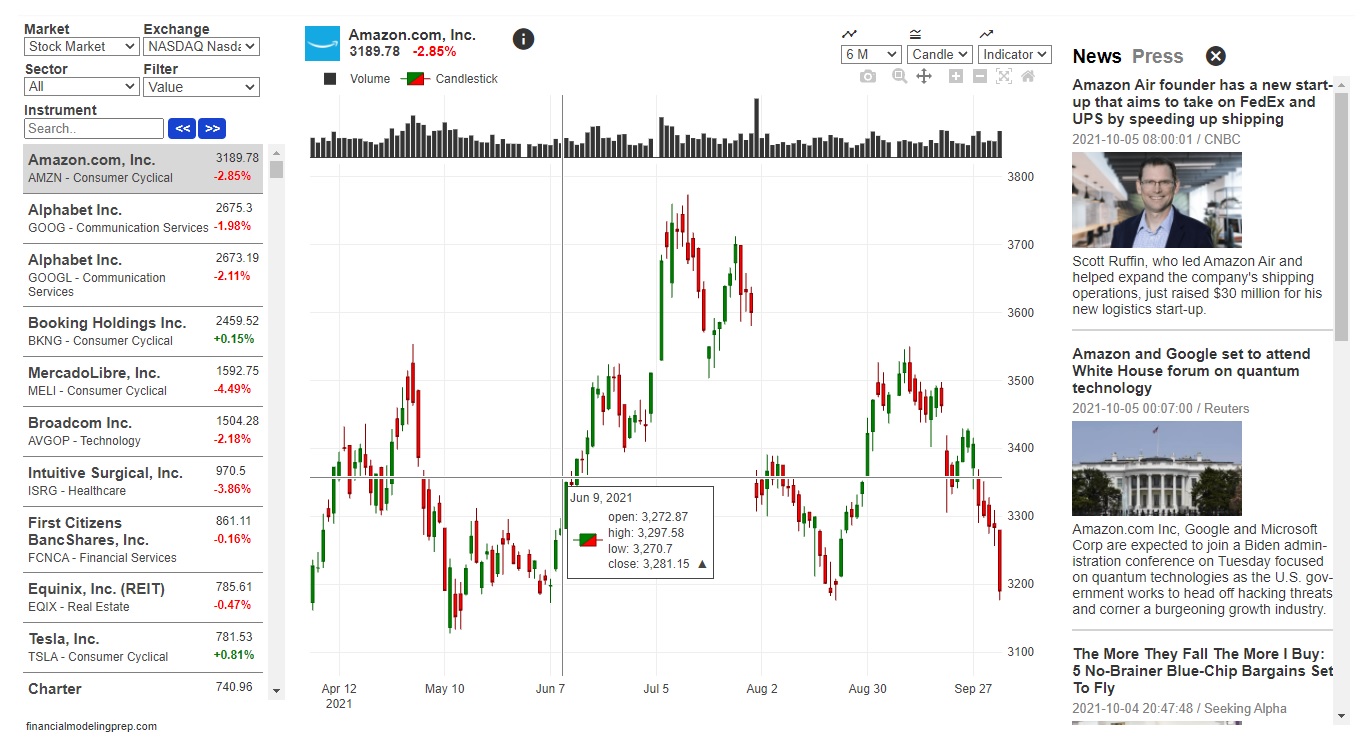
Interactive Dashboard
Financial Data from Stock Markets and financial instruments.
Current and historical Stock Data with latest news and press release (NASDAQ, NYSE, XETRA, HKSE, TSX, SIX, MCX)
Forex, ETF, Cryptorurrencies, Commodities, Funds.
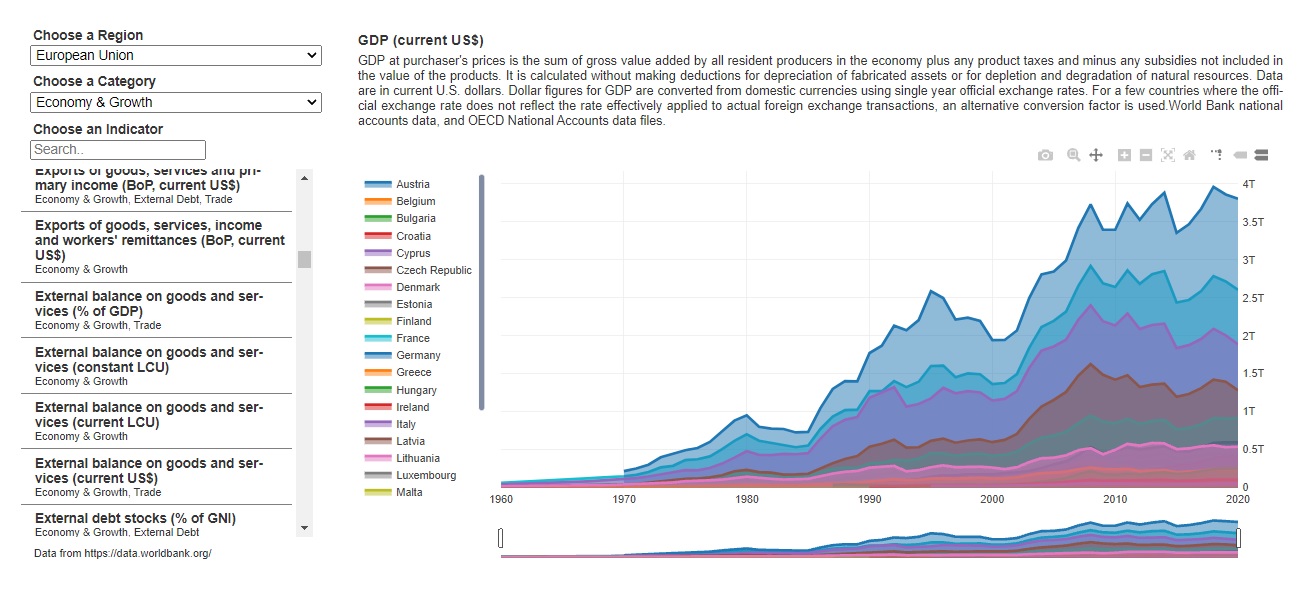
Interactive Dashboard
Worldbank Data from https://data.worldbank.org/
Economy, Infrastrucrure, Education, Health, Science & Technology, Climate Change Social Development, Agriculture, Energy, Mining, Environment, Poverty, Health, Trade etc.
Interactive Simulation
Mathematical Visualization of Fourier Transformation.
Interactive Chart of time signal and spectrum with slider control of the variables.
Ultrashort Pulse (Pulse shape, Fourier limited pulse width, bandwidth, frequency spacing)
Pulse Train (Fourier Series generating a rectangular function, period, frequency count)
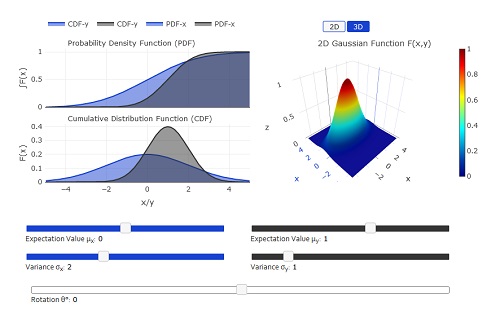
Interactive Simulation
Mathematical Visualization of Gaussian Function.
Interactive Chart of probabilty density function, cumulative distribution function and 2D Gaussian function with slider control of the variables.
Probability Theory, Statistics, Expectation Value, Variance, Rotation.
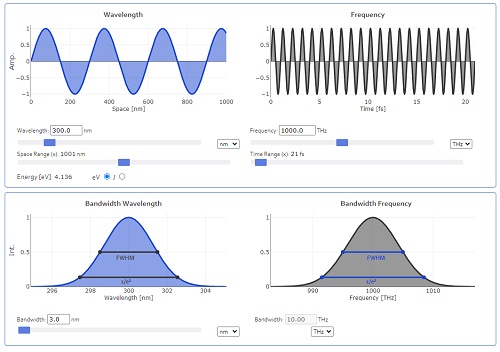
Interactive Simulation
Mathematical Visualization of Electromagnetic Radiation.
Interactive Chart of wavelength, frequency, energy and bandwidth with slider control of the variables.
Conversion of wavelength to frequency and the visualization of the electromagnetic wave in space and time.
Planck's constant h, frequency components, electromagnetic signal, energy (eV).